Visualising Related Parties
Outside of the Related Parties task, currently there are three ways that entity relationships are displayed:
- Relationships grid on Entity Profile page
- Organization Chart view
- Associations Graph view
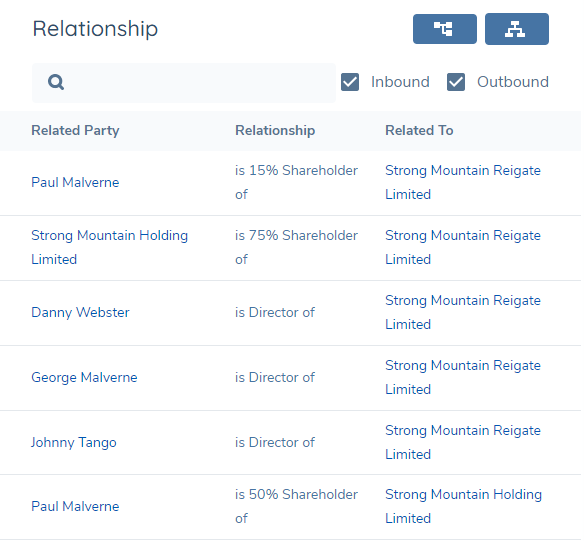
Entity Profile
The Entity Profile page for any entity will display a grid showing verified inbound and outbound relationships for the entity in context. It will also display any verified relationships for the entity’s related parties and present all of this in a flat grid.
For a given root entity, the inbound relationships are that entity’s chain of related parties that are targeting the root entity. In the example below where the root entity is Columbus Group Limited, an inbound relationship would be Joe Mazereki who is the CEO of that root entity. Coversely, a root entity’s outbound relationships are the chains of relationships where the root entity is targeting other entities which may be clients themselves. In the example below, an outbound relationship would be Nomad Group which has Columbus Group Limited as a shareholder.
To make this distinction clearer, in the Relationship column inbound relationships are prefixed with ‘is’ and outbound relationships are prefixed with ‘has’. You may use the search box to filter the grid and/or you may use the Inbound and Outbound checkboxes to display only relationships in a particular direction.
Organization Chart View (BETA)
The BETA Organization Chart view can be accessed by clicking on the below icon from the Relationships grid on the Entity Profile page.
![]()
It illustrates the hierarchy from a top-down perspective, showing only verified inbound relationships. If an entity is connected to another in multiple capacities, these relationship types will be combined within each box.
The 'Products' toggle can be used to reveal the verified products associated with each entity displayed in the Organigram. It is disabled by default. To view products, enable the toggle and click on the search icon.
The Product toggle is hidden when the Dynamic Access Layer toggle is enabled and the Product Access Layer feature is active. To display the Product toggle, disable the Dynamic Access Layer toggle.
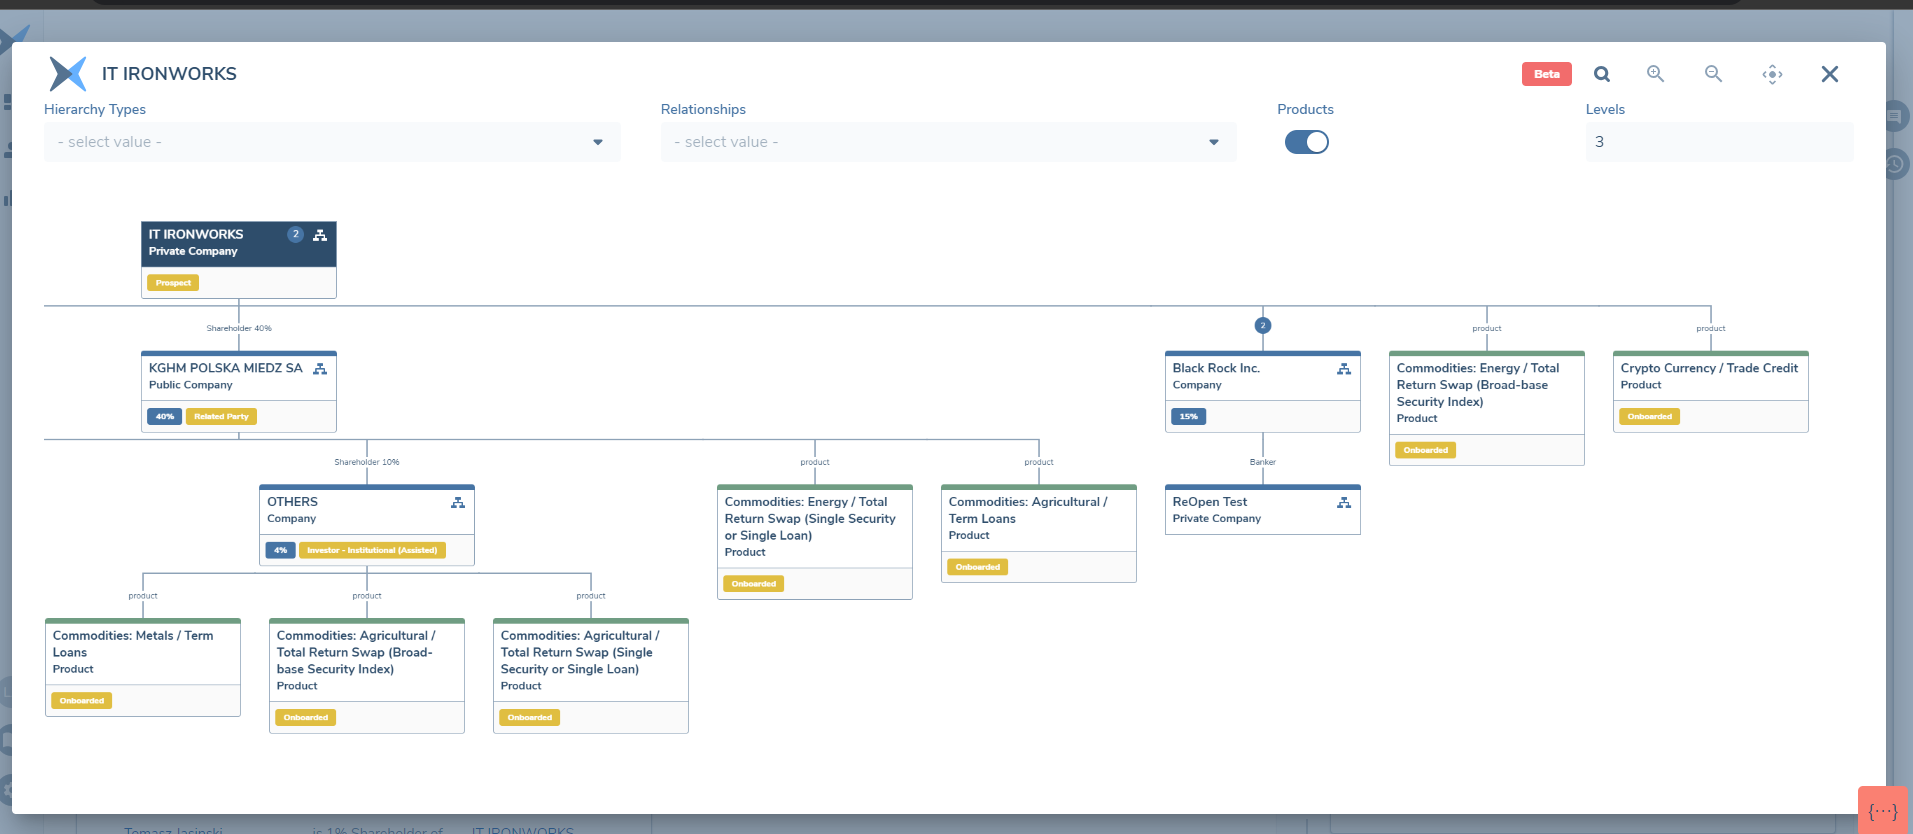
The colour of the entity instance within this view is representative of the different entity types:
- Solid Blue represents the entity in profile
- Blue line represents Company entity types
- Yellow line represents Individual entity types
- Grey line represents Other entity types
- Green line represents Product entity types
To enable the Hierarchy Types dropdown, configure and publish a linked lookup named Organigram Hierarchy Types / Relationships, where Organigram Hierarchy Types acts as the parent and Relationships as the child, forming a parent–child structure between the two.
Download Chart
To download a copy of the chart, click the download icon. The chart can be downloaded in PDF or PNG format, and can be customised to include Fenergo branding and a date stamp.

Associations Graph View
The Associations Graph view can be accessed by clicking on the below icon from the Relationships grid on the Entity Profile page.
![]()
It will display a radial graph with the entity in context at the centre. Each entity is represented by a node and each relationship type is represented by a line between the two connected entities, with an arrow showing the direction of the relationship. These will always show the verified inbound and outbound relationships only where the direction of the arrow will indicate whether the relationship is inbound or outbound.
![]()